Vegetation Monitoring (NDVI/EVI)
Monitor vegetation health and growth using NDVI/EVI from Sentinel‑2 and Landsat. GRAI runs robust time‑series analysis with cloud masking, compositing, and clear charts for fast insight.
Why It’s Useful (at a glance)
6 key advantages
- 10–30 m detail: Sentinel‑2 (10 m) and Landsat (30 m).
- NDVI + EVI: Greenness plus high‑biomass robustness.
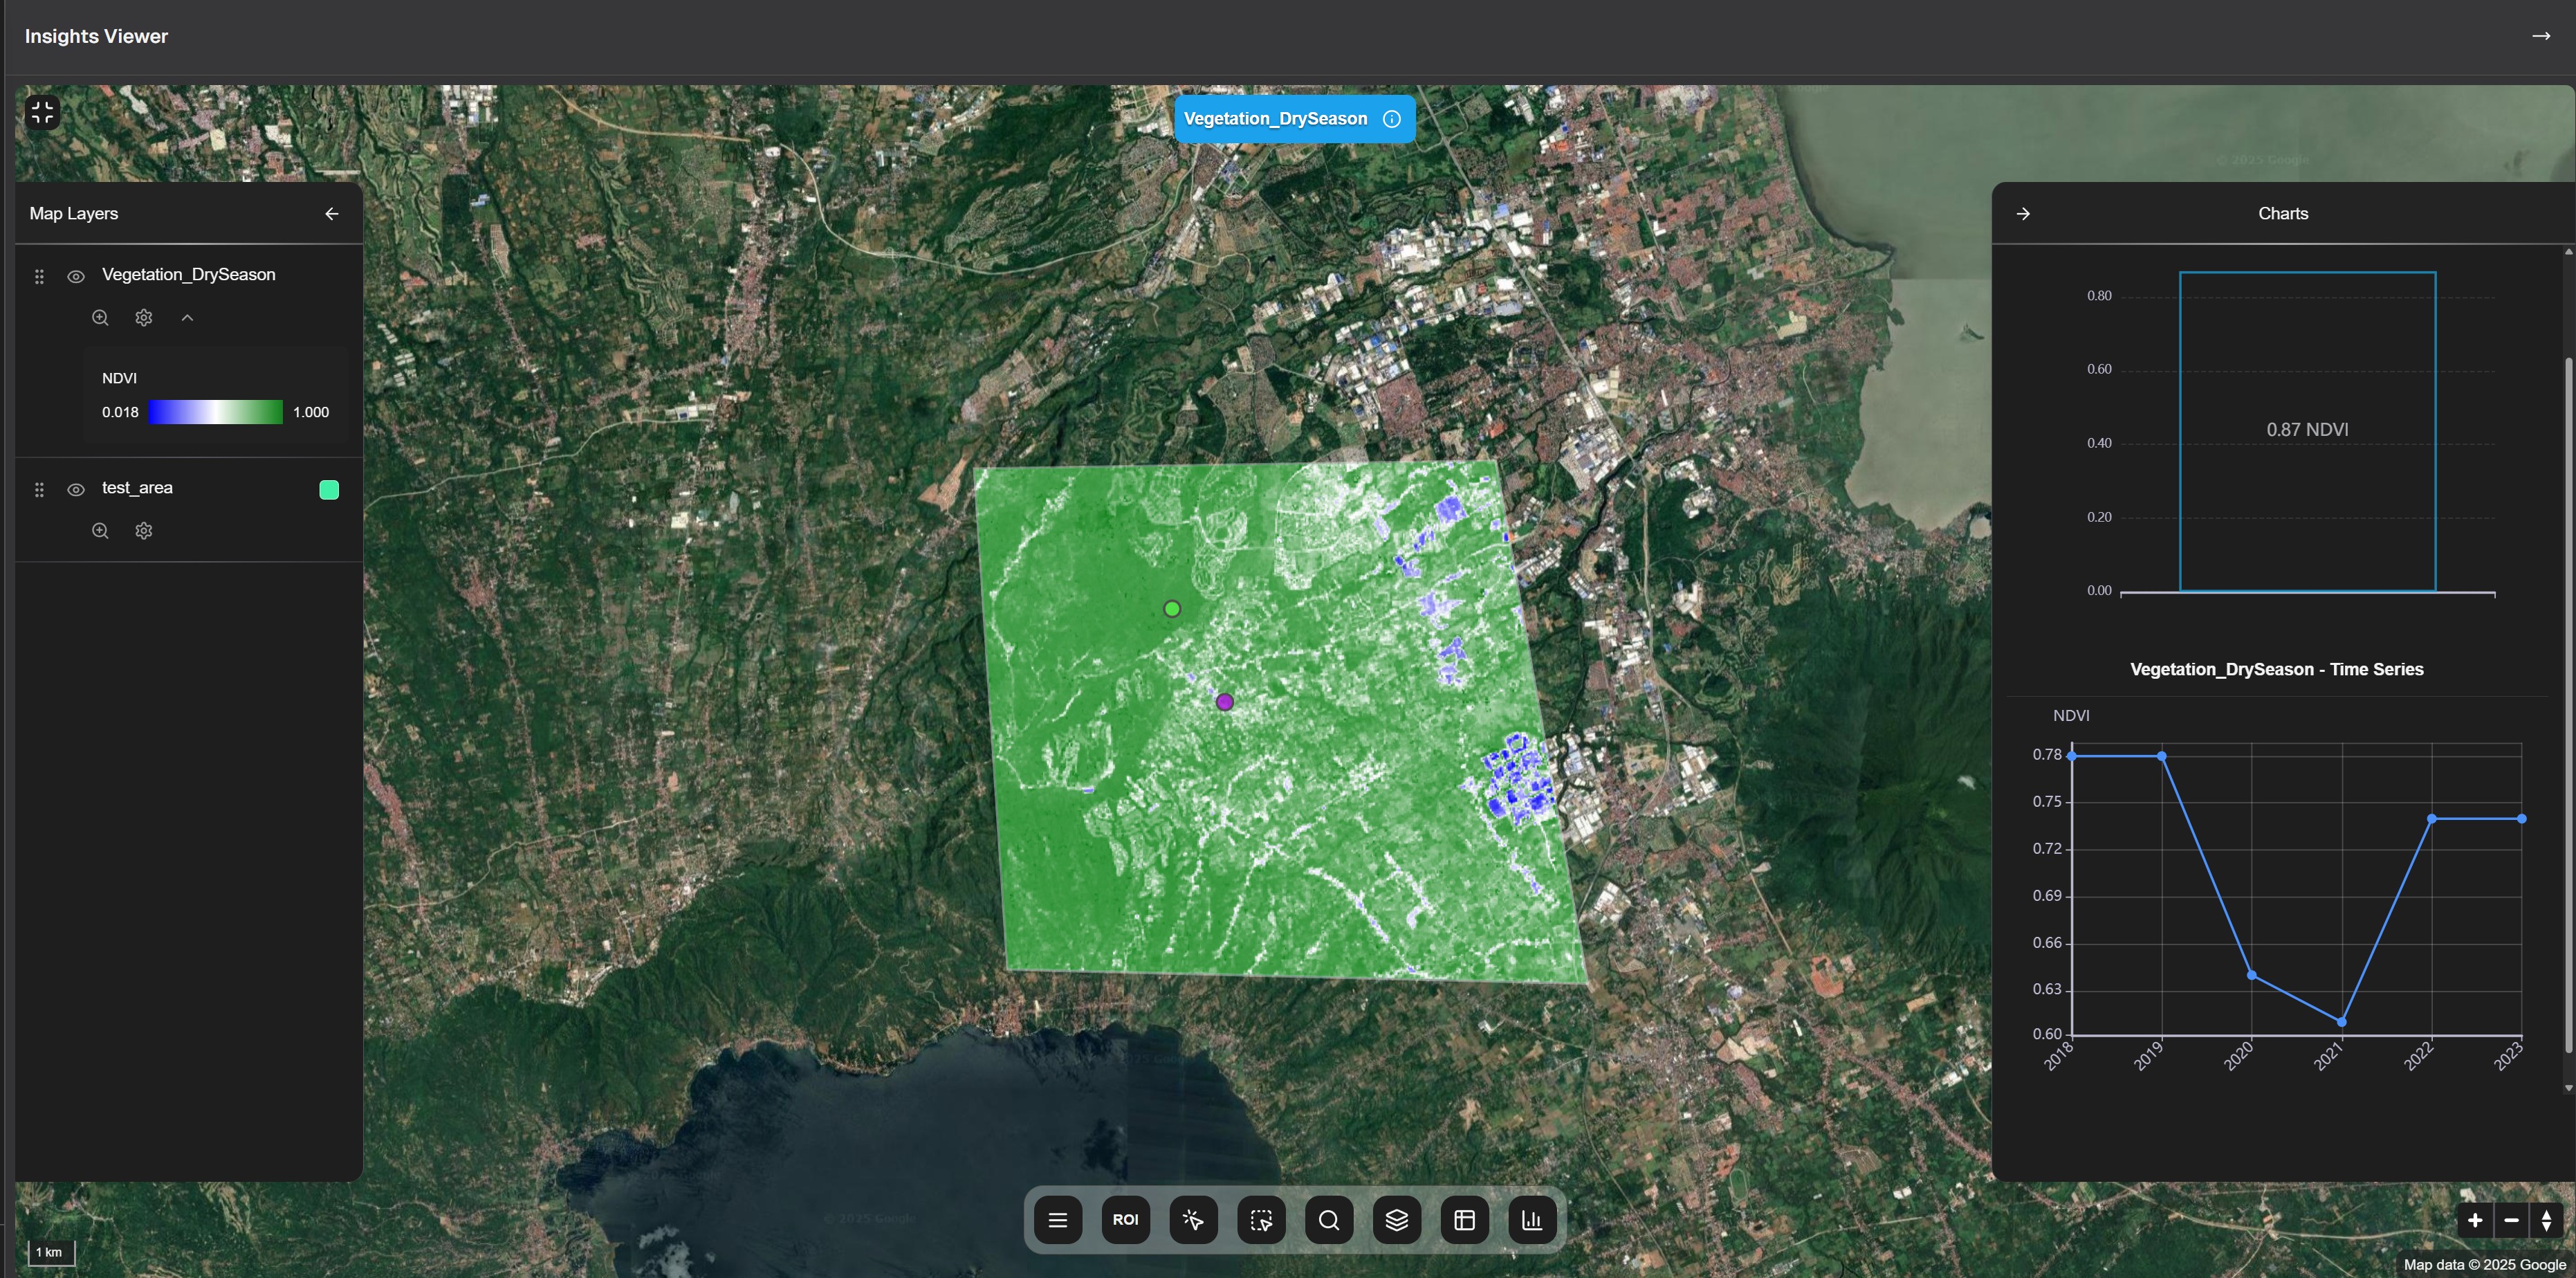
- Time‑series: Seasonal and multi‑year trend analysis.
- Clean inputs: Cloud/shadow masking and temporal composites.
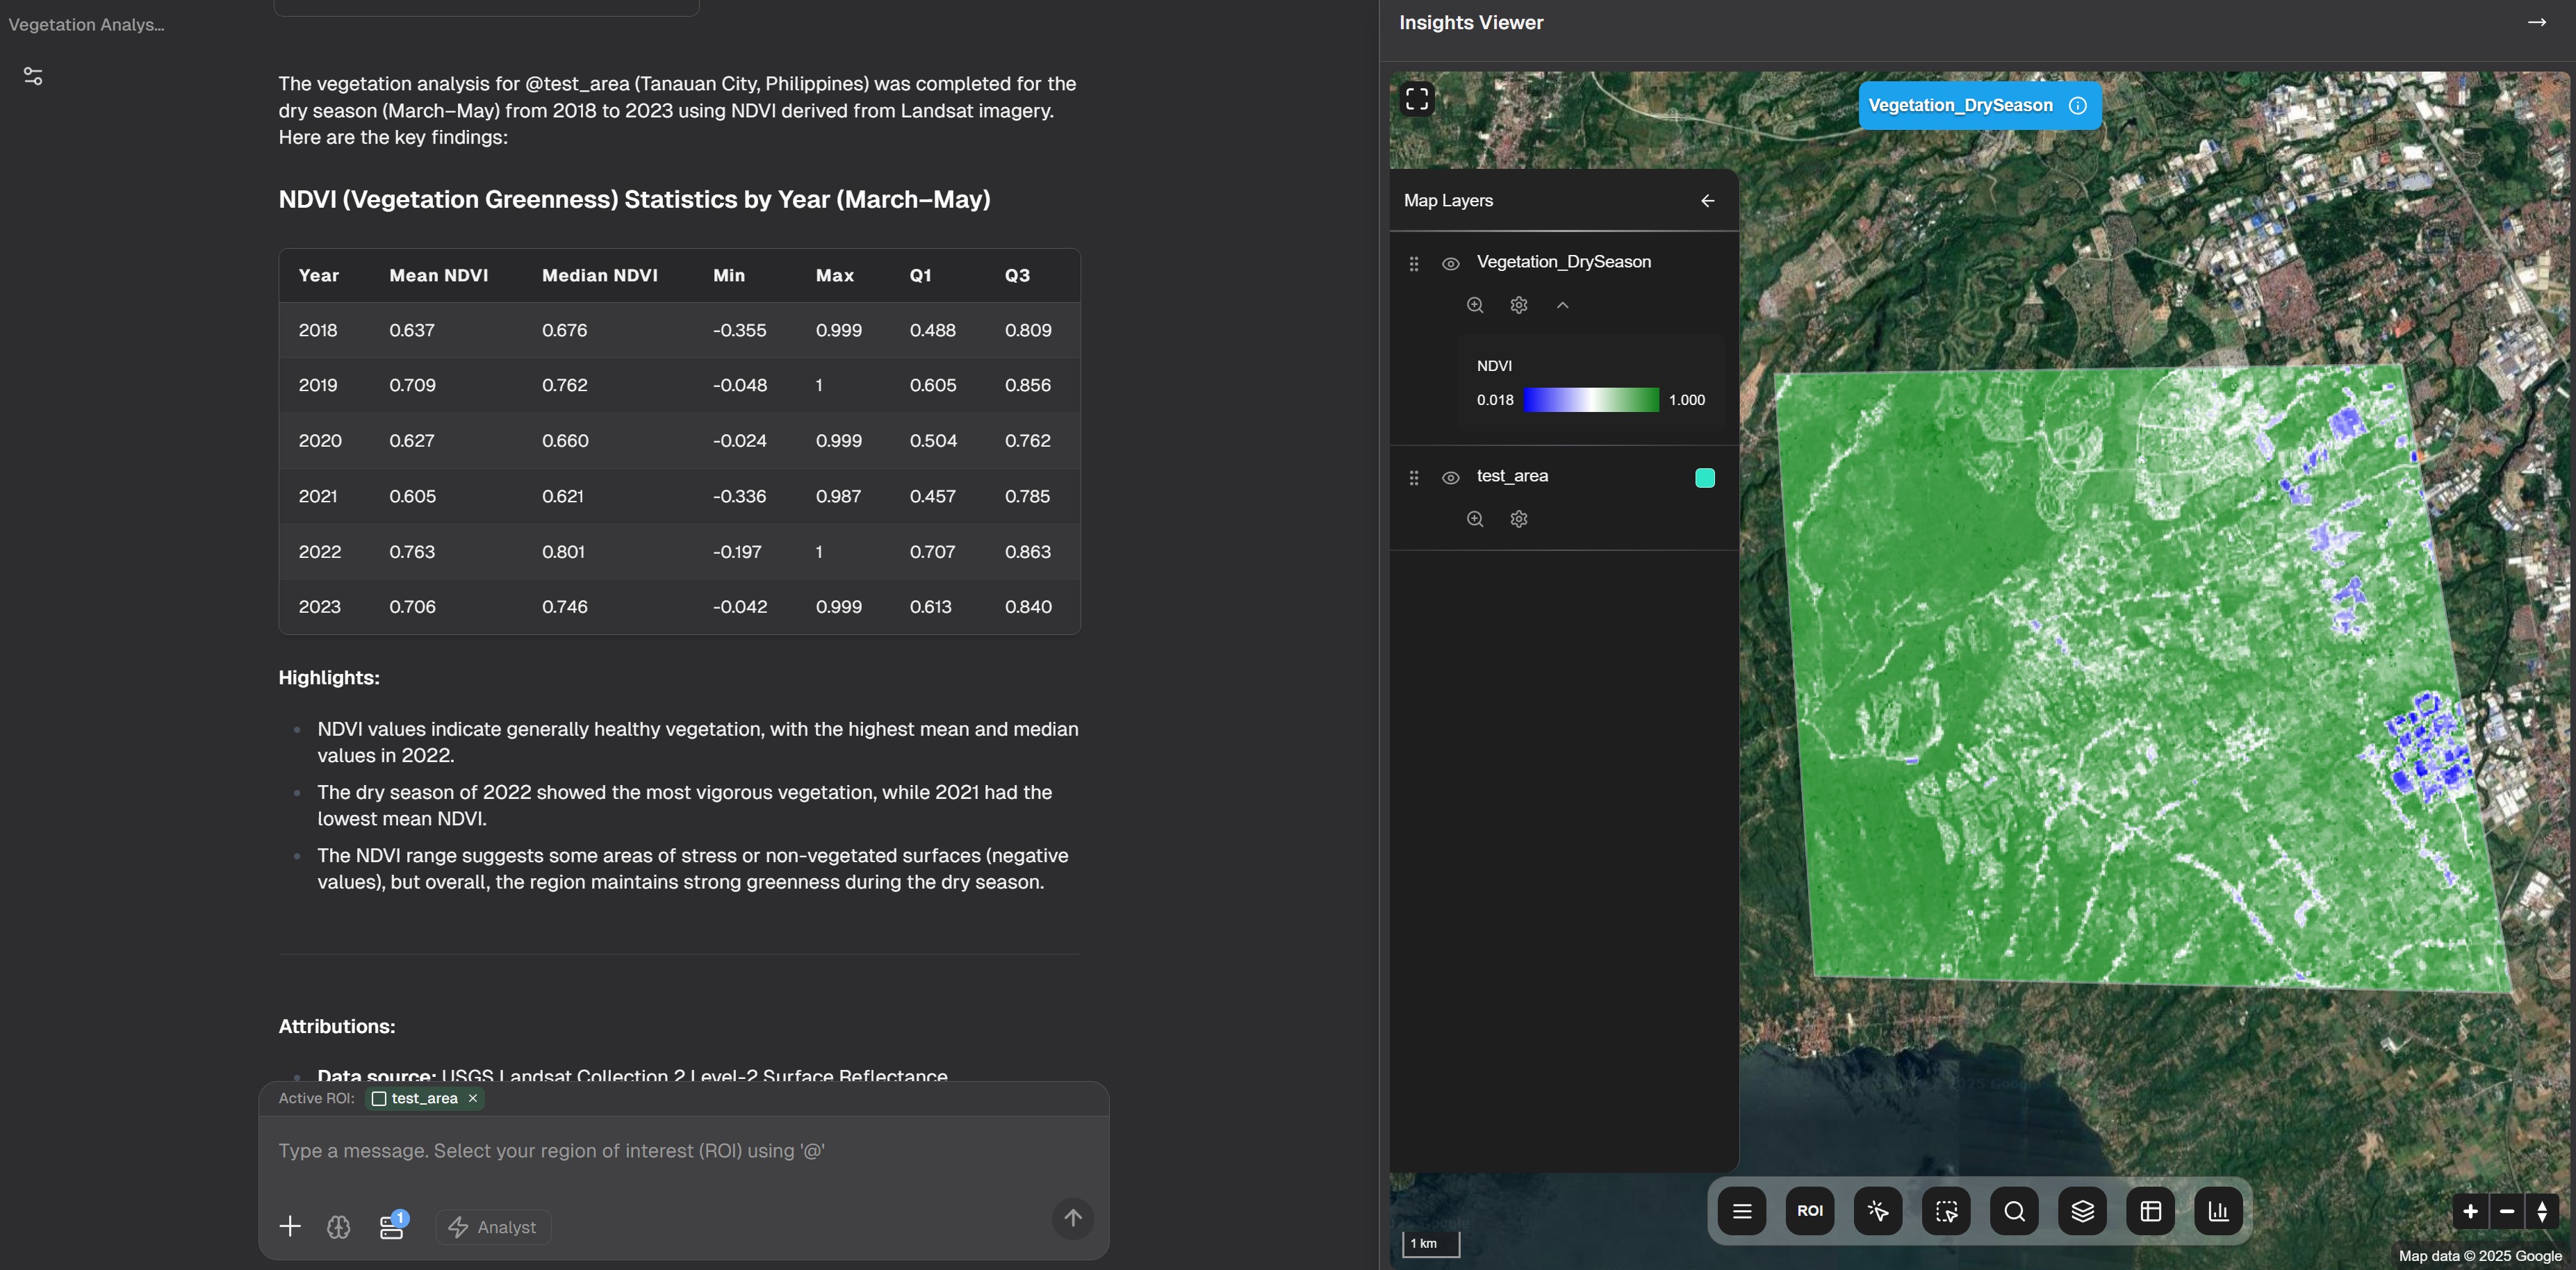
- Flexible views: Point and area analysis with stats.
- Broad coverage: Crops, forests, grasslands, and urban greening.
Capabilities & Data (concise)
• Indices: NDVI, EVI with proper atmospheric handling for dense canopies • Sources: Sentinel‑2 (~5‑day revisit, 10 m) and Landsat 8/9 (16‑day, 30 m) • Outputs: maps, time‑series charts, and summary stats (min/mean/max, quartiles) • Periods: monthly/seasonal windows or custom date ranges across years
Simple Query Interface
Show NDVI trends for these fields from 2018 to 2024
Monitor forest health and recovery after the 2020 wildfire
Detect drought stress patterns during recent dry years
Compare EVI vs NDVI for dense canopy evaluation
Example Use Cases
Track within-season and year-over-year field vigor
Monitor post-disturbance recovery and biomass trends
Identify stress periods and compare across seasons
Assess park tree canopy and greening initiatives
Verify planting success and canopy establishment over years
Use NDVI/EVI trends as biomass/sequestration indicators
Getting Started
- Draw your area of interest.
- Pick time window(s): seasonal or custom multi‑year.
- Choose index: NDVI, EVI, or both.
- Review maps, charts, and stats; compare years.
Interactive Exploration
Quick Tips
- Use consistent seasons for fair comparisons.
- Combine NDVI and EVI for dense canopies.
- Prefer composites to reduce cloud/noise.
- Interpret with local knowledge and field checks where possible.