Query Loops
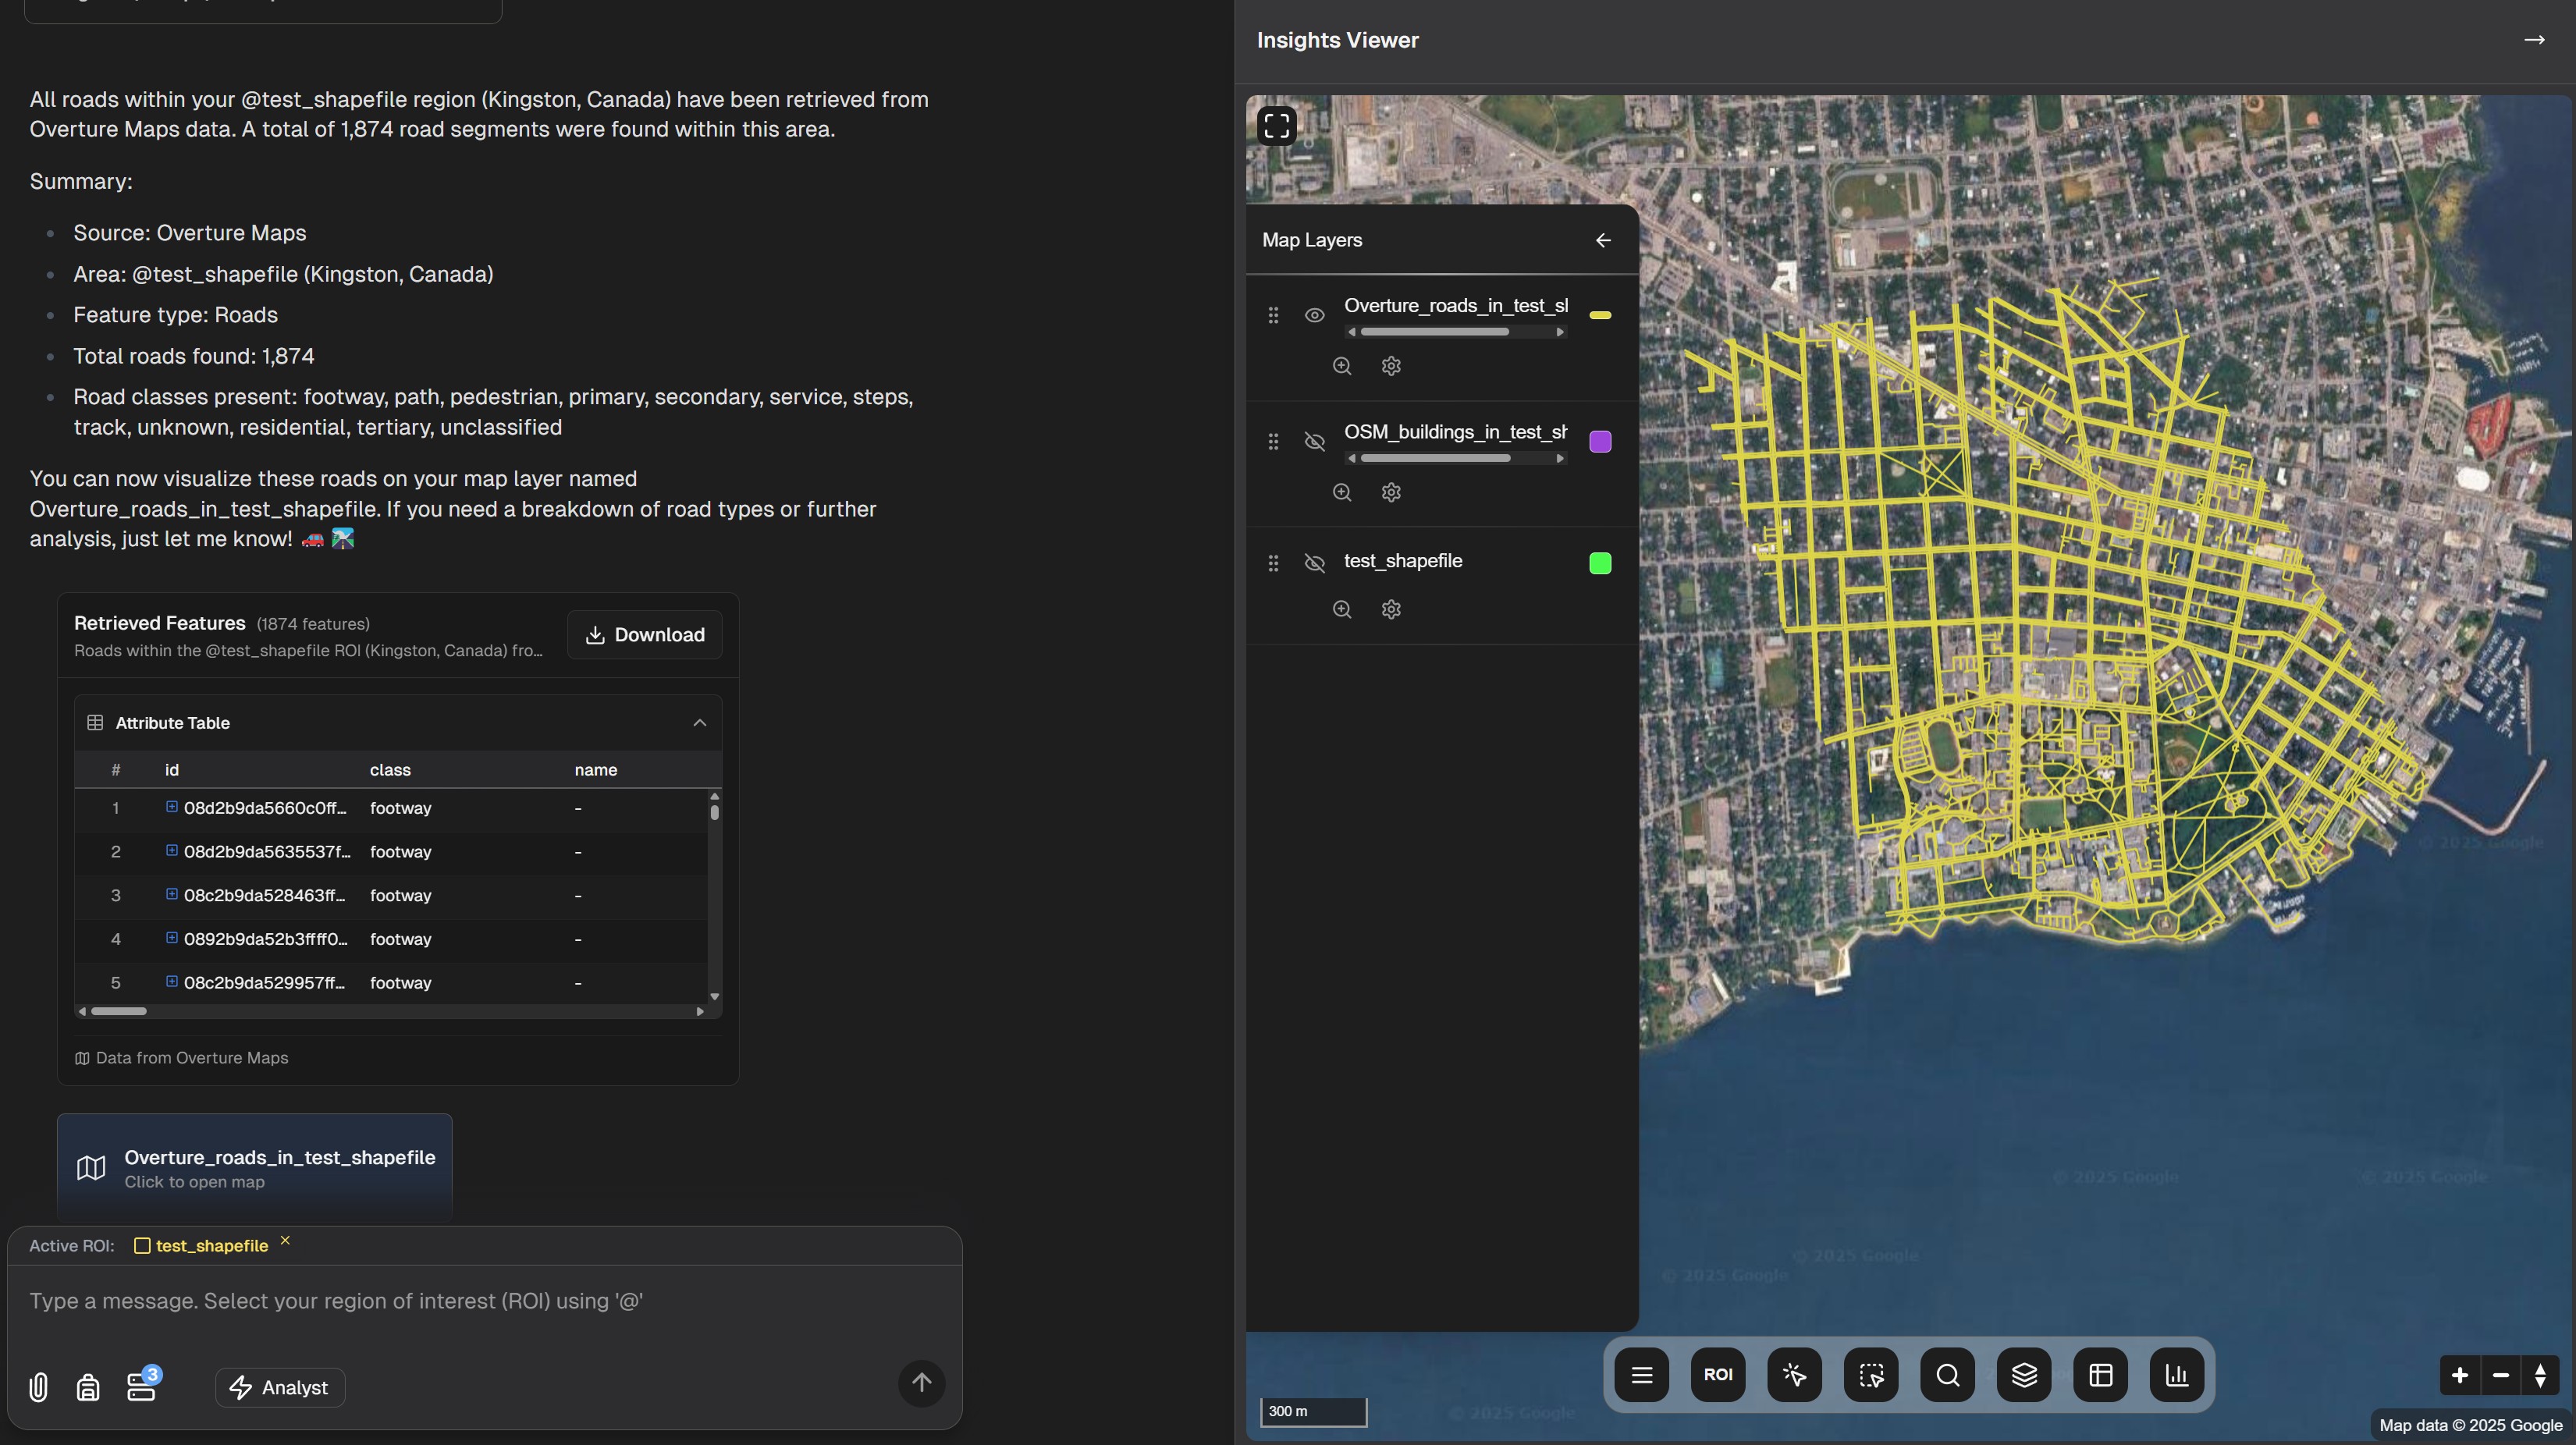
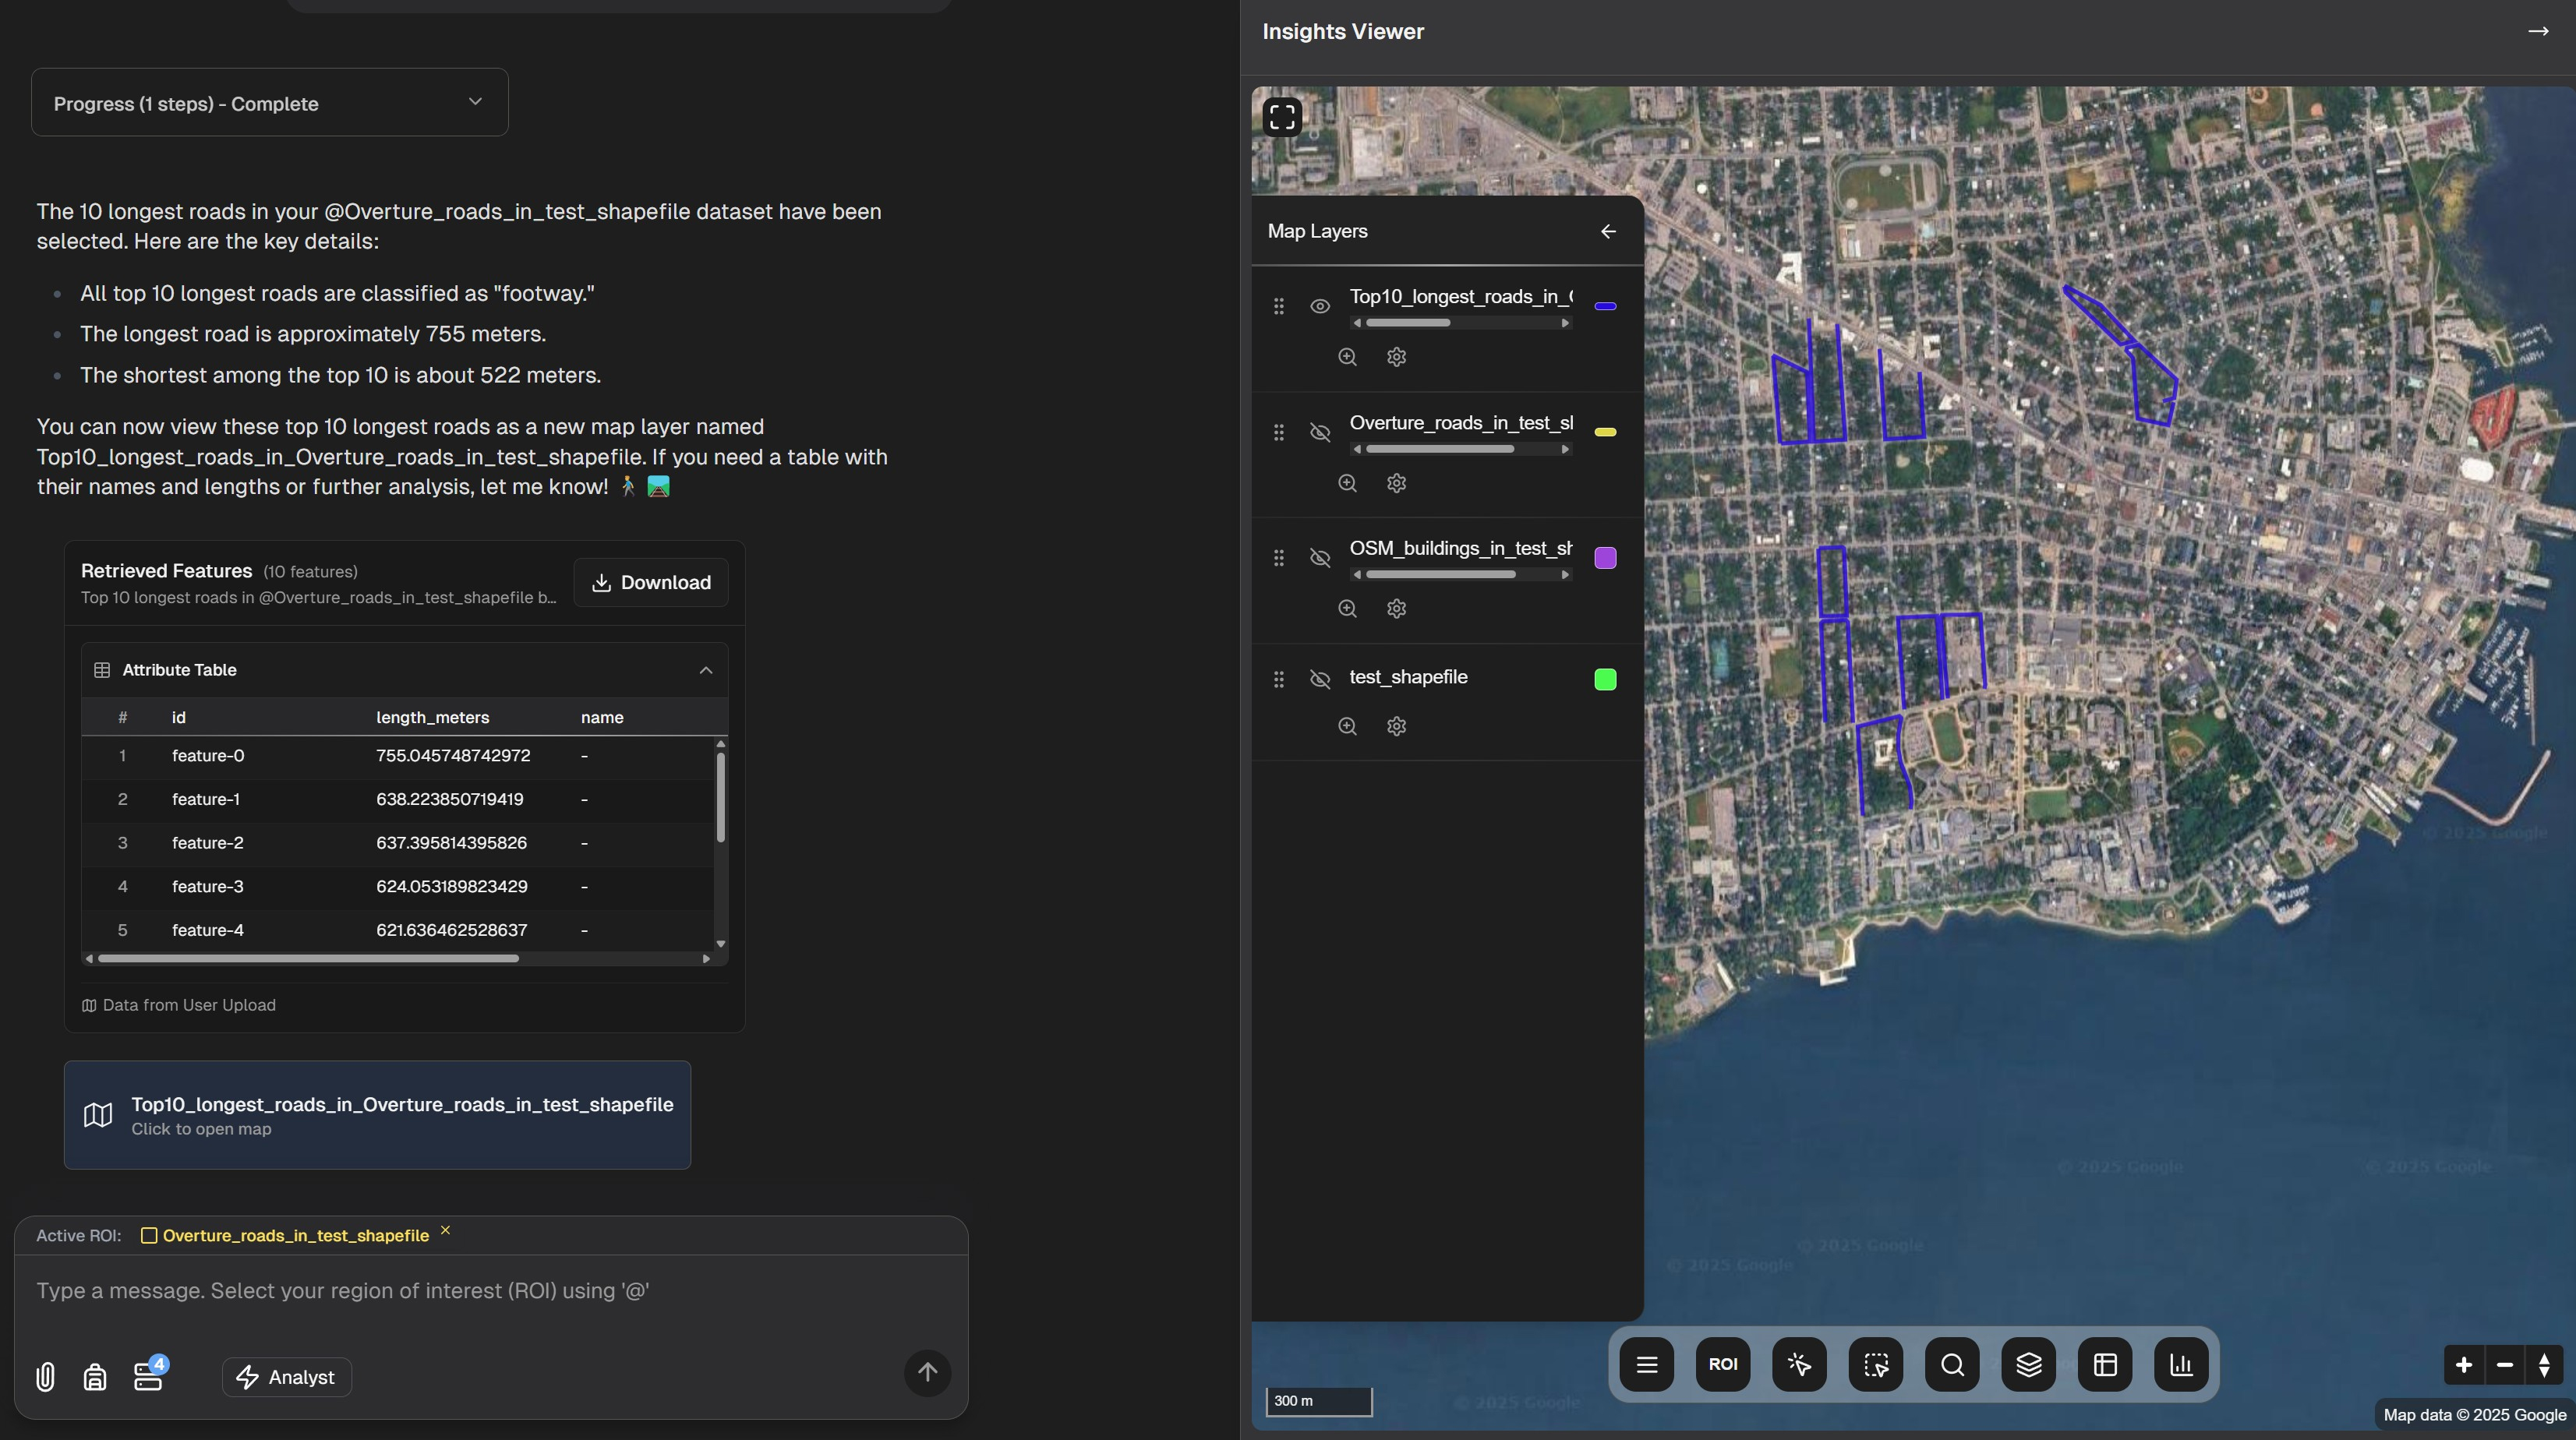
Query loops are a powerful feature of GeoRetina AI that allows you to build on previous query results, enabling multi-step analysis and progressive refinement of your insights.
What are Query Loops?
Query loops let you use the results of one query as the input for subsequent queries. This creates an iterative analysis workflow where you can:
- Narrow down from broad initial results to specific insights
- Apply multiple filters or conditions in sequence
- Build complex analytical workflows through simple conversational steps
- Refine your analysis based on intermediate findings
How Query Loops Work
When you run an initial query, GRAI returns a set of results. Rather than starting a completely new query, you can refer to "these results" or "the selected features" in your follow-up questions, creating a loop of increasingly refined analysis.
Example Workflow
-
Initial query: "Show me all schools in this region"

-
View initial results: GRAI returns matching features

-
Follow-up query: "Of these schools, show me only those with more than 500 students"
-
Further refinement: "Among these results, which ones are within 1km of a park?"
-
Final analysis: "For these remaining schools, what's the average distance to the nearest hospital?"

Each step builds on the previous result set, creating a logical chain of analysis.
Benefits of Query Loops
Query loops offer several advantages:
- Simplified complex analysis: Break down complex questions into manageable steps
- Interactive exploration: Adjust your approach based on intermediate findings
- Reduced data processing: Focus only on relevant subsets of data
- Intuitive workflow: Mirrors how people naturally think about multi-step analysis
- Transparent process: Each step is clearly documented in the conversation
Common Query Loop Patterns
Filter Refinement
Start with a broad set and progressively apply filters:
Progressive Filtering Workflow
Show me all buildings in this area
Of these buildings, show only commercial properties
Among these commercial properties, which ones were built after 2000?
Of these newer buildings, which ones have solar panels installed?
Comparative Analysis
Compare different subsets of data:
Show me all parks in the city
Now show me parks that have playgrounds
Compare the average size of parks with playgrounds to those without
Spatial Relationships
Explore how features relate to each other:
Show me all hospitals in the region
Now show me residential areas within 2km of these hospitals
Of these residential areas, which ones have the highest population density?
Sequential Calculations
Perform calculations at each step:
Show me all agricultural parcels in the county
Calculate the total area of these parcels
Of these parcels, show only those growing corn
What percentage of the total agricultural area is used for corn?
Tips for Effective Query Loops
To get the most out of query loops:
- Start broad, then narrow: Begin with a larger dataset and refine
- Use clear references: Phrases like "these results," "these features," or "among these" help GRAI understand you're building on previous results
- Verify intermediate steps: Make sure each step gives you the expected results before proceeding
- Combine with other data sources: Bring in additional datasets at different stages of your analysis
- Save important results: Export critical findings at various points in your analysis workflow
Limitations
Some current limitations to be aware of:
- Query loops work best with vector data (as opposed to raster/satellite data)
- Very large result sets may need to be further filtered before detailed analysis
- Complex chains with many steps might require occasional clarification
- Some advanced spatial operations may not be available for all data types
Examples of Real-World Applications
Urban Planning
Urban Development Analysis
Step-by-step analysis for urban planning and development opportunities
Show me all vacant lots in the downtown area
Of these lots, which ones are zoned for commercial use?
Among these commercial lots, which ones are within 500m of public transportation?
For these well-connected lots, what's the current market value per square meter?
Environmental Analysis
Environmental Impact Assessment
Multi-step environmental analysis for identifying pollution sources and ecosystem threats
Show me all wetlands in the county
Of these wetlands, which ones have decreased in size over the past 10 years?
For these shrinking wetlands, are there any industrial facilities within 1km?
Among these facilities, which ones have reported chemical discharges?
Infrastructure Planning
Infrastructure Gap Analysis
Systematic approach to identifying and addressing infrastructure deficiencies
Show me all neighborhoods in the city
Of these neighborhoods, which ones have the lowest coverage of fiber internet?
Among these underserved areas, what's the population density?
In these high-density, underserved areas, where would be the optimal locations for new fiber nodes?
Getting Started with Query Loops
The best way to master query loops is through practice. Start with simple two-step analyses and gradually build up to more complex workflows as you become familiar with the capabilities.